

Sheffield House Prices Divergence - Silverdale Close, Affluent Area's Forecast
06-30-2014
By: N_Walayat

Sheffield house prices are showing a huge divergence between affluent and deprived areas of the city in terms of the rate of annual increase where typically affluent areas of the city are experiencing a trend in house price inflation of an average of 5% per annum whilst deprived areas are experiencing what can only be classed as random price action, where similar properties even on the same street can deviate greatly by as much as 1/3rd in price as illustrated by several study's of sale prices of properties sold across streets in deprived areas of the city that have yet to exhibit a trend in house prices.
S4 - Popple Street by Sale Date
| House No | Date Last Sale | Price Paid |
| 100 | Apr 14 | 45000 |
| 18 | Jan 14 | 66000 |
| 97 | Feb 13 | 52500 |
| 18 | Oct 12 | 70000 |
| 127 | June 12 | 49000 |
| 134 | Mar 12 | 46000 |
| 55 | Jan 12 | 40000 |
| 31 | Dec 11 | 40000 |
| 43 | Jul 11 | 51000 |
| 90 | June 11 | 69000 |
| 43 | Sept 10 | 47000 |
| 22 | Sept 10 | 65000 |
| 10 | June 10 | 80000 |
No clear discernable trend.
The below map illustrates the conclusion of - 31 Oct 2013 - Sheffield Best and Worst Areas to Live, House Buying Analysis Map
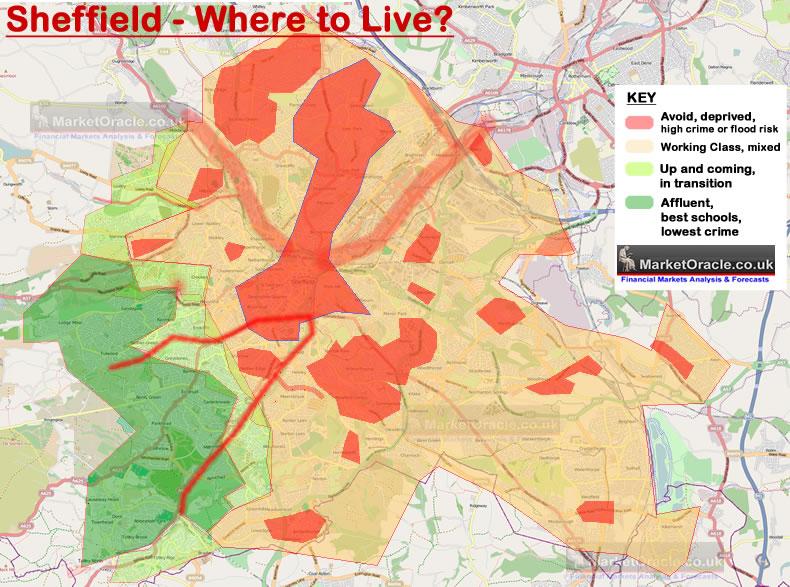
Click here for a Large version of the Where to Live Map
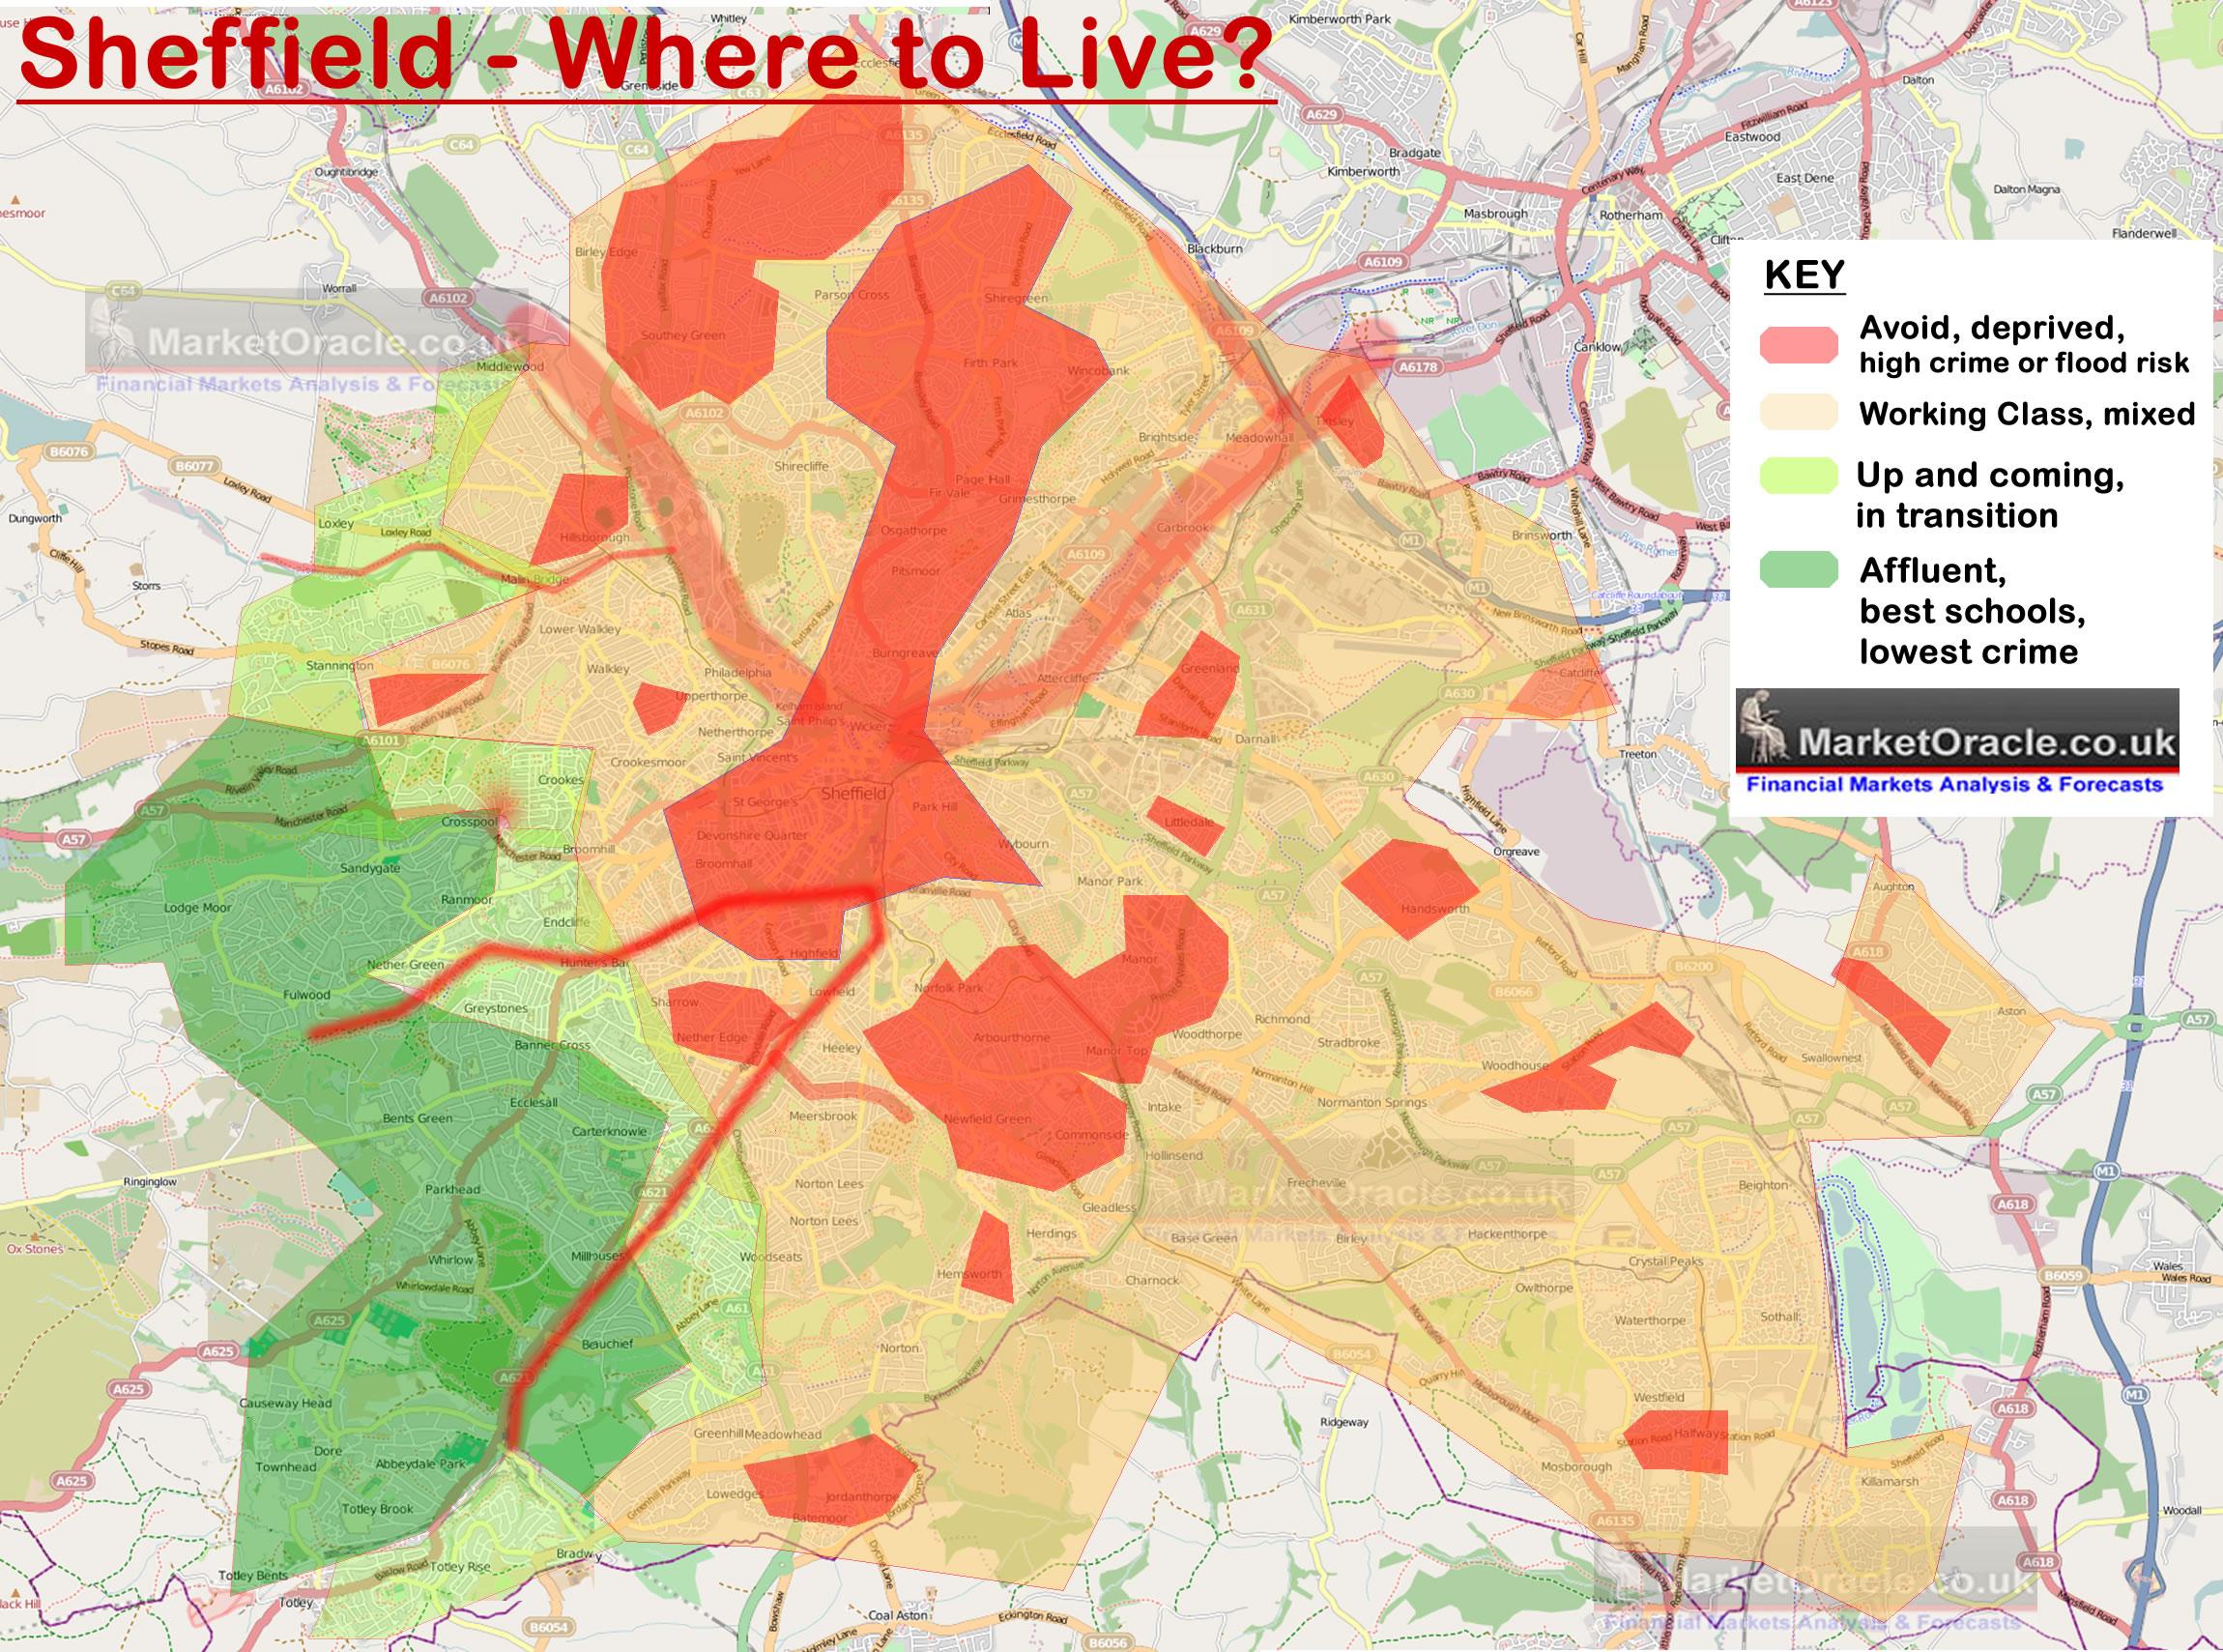
In summary, prospective home buyers should take notice of the fragmented nature of the city which can make a huge differences both in terms of the quality of life, school catchment etc. However, the best areas of the city can be found to be concentrated in the South West of the city as the affluent residents continue to price most local house hunters out of these areas, just as is the case for many areas of the UK. Furthermore, the most affluent area's of the city tend to have a buffer zone of up and coming areas that acts to further the gap in house prices between relatively short distances.
Affluent Areas of Sheffield
Sheffield House prices in the S11 area as illustrated by analysis of Silverdale Close are increasing at an average rate of 5% per annum, a trend that is inline with the national forecast for the UK housing bull market to trend higher into the end of 2018 and therefore whilst lagging the national average (10% per annum) still is represents a huge difference to that that which is transpiring in the deprived areas of the city.
However, it should be noted that house price valuation sites such as Zoopla and Mousprice.com tend to typically over value properties by an average of 5% as illustrated by the in-depth analysis of Silverdale Close, that could be extrapolated to other streets in the area.
S11 - Silverdale Close Ranked by Current Estimated Value
| Rank | House No | Zoopla/ Mouse Price Etc. | Analysed Est. Value | % over valued | Date Last Sale | Price Paid | Beds | Trend Forecast End 2018 |
|---|---|---|---|---|---|---|---|---|
| 1 | 9 | £552k | £525k | 4.8% | Dec 2009 | £499k | 5 | £630k |
| 2 | 3 | £498k | £479k | 3.8% | Jan 2012 | £450k | 6 | £575k |
| 3 | 7 | £471k | £460k | 2.3% | 5 | £552k | ||
| 4 | 27 | £465k | £450k | 3.2% | 4 | £526k | ||
| 4 | 29 | £463k | £450k | 2.8% | Apr 2008 | £450k | 4 | £527k |
| 6 | 21 | £474k | £446k | 5.9% | Oct 2013 | £422k | 4 | £522k |
| 7 | 18 | £437k | £441k | 1% | Sep 2010 | £405k | 5 | £529k |
| 7 | 19 | £468k | £441k | 5.7% | 4 | £516k | ||
| 7 | 20 | £471k | £441k | 6.3% | 4 | £516k | ||
| 7 | 25 | £456k | £441k | 3.2% | 4 | £529k | ||
| 11 | 5 | £419k | £435k | 3.8% | Jul 2006 | £390k | 4 | £522k |
| 11 | 6 | £459k | £435k | 5.2% | May 1998 | £155k | 4 | £522k |
| 11 | 10 | £441k | £435k | 1.3% | Jun 2002 | £225k | 5 | £508k |
| 11 | 12 | £453k | £435k | 3.9% | 5 | £537k | ||
| 11 | 16 | £456k | £435k | 9.2% | 4 | £509k | ||
| 16 | 23 | £441k | £435k | 1.3% | Apr 2012 | £405k | 4 | £522k |
| 17 | 1 | £452k | £431k | 4.5% | 5 | £517k | ||
| 18 | 15 | £458k | £430k | 6% | 4 | £503k | ||
| 19 | 4 | £440k | £421k | 4.3% | Feb 2013 | £390k | 4 | £485k |
| 20 | 8 | £440k | £414k | 5.9% | 4 | £484k | ||
| 20 | 11 | £413k | £414k | 4 | £497k | |||
| 20 | 14 | £456k | £414k | 9% | Aug 2003 | £332k | 5 | £497k |
| 20 | 17 | £450k | £414k | 8% | Sep 1997 | £135k | 4 | £484k |
| 24 | 2 | £399k | £390k | 2% | Nov 2011 | £371k | 4 | £450k |
* Analysed value takes into account Zoopla / Mouse price estimates, Last sale, recent similar sales in the area and current property structure (allowing for any additions etc).
* Forecast is based on average expectations of 5% per annum adjusted for trend trajectory over the past 2 years or since last sale.
Sheffield House Prices Conclusion
1. Deprived areas of the city have yet to exhibit a trend in house prices.
2. Affluent areas of the city are exhibiting an average trend of 5% per annum with a typical range of between 3.5% to 7%. This trend whilst lagging behind national house price inflation of 10% per annum is sustainable into at least the end 2018.
3. House price valuation sites typically tend to over value house prices by an average of 5%. Though the over valuation for individual properties can be substantial, therefore like for like comparisons need to be conducted against actual sold prices.
For more in-depth analysis of the UK housing market see the New UK Housing Market Ebook available for FREE DOWNLOAD (Only requirement is a valid email address).