Goldman Sachs has had a look attempts to lean against house price cycles by central banks, in 20 OECD countries from 1990 to 2012, to see what effect they have had.
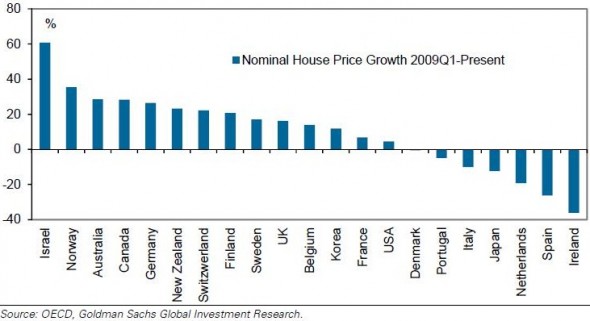
More on that below, but first a striking chart of post-Great Recession house price trends (from the first quarter of 2009 to now):
Note also that several of the booming (bubbling?) markets on the left are those which didn’t collapse in the recession.
Relative to their previous peaks, nominal house prices are now 43% higher in Norway, 20% higher in Canada, 14% higher in Israel and 7% higher in Australia.
The last burst of capitulation, perhaps, as the final resolute doubters on housing finally give in and buy, seeing as how super low interest rates make mortgages appear to be cheap. (Feel free to substitute you own post hoc rationale here).
But central bankers in some countries are concerned. The UK’s Financial Policy Committee may insist on tighter lending standards. The Reserve Bank of New Zealand has told its lenders to limit risky loans (those with more than an 80 per cent loan to value) to a tenth of new mortgage lending.
Which brings us to the details of Goldman’s research. The economics team has looked at the macro-prudential tools and choices made by central bankers over the last two decades that separate from interest rate policy and are expressly counter-cyclical – nothing to encourage home ownership, or the affordability of housing counts. Nor do pro-cyclical measures that fuel a boom or starve a bust.
Canada, for instance, has been belatedly fighting the boom tendency.
In Canada, nominal house prices did not fall much during the GFC and have risen steadily since 2009. Homebuilding activities have also exceeded their pre-GFC levels. In response, the Ministry of Finance lowered the maximum LTV ratio from 100% to 95%, reduced the maximum amortisation period from 40 years to 35 years, and set the maximum DSTI ratio to 45% in October 2008. In April 2010, it lowered the maximum LTV ratio further to 90% for refinancing mortgages and to 80% for investor properties. In March 2011, the authorities reduced the maximum amortisation period from 35 years to 30 years and decreased the maximum LTV ratio to 85% for refinancing mortgages.
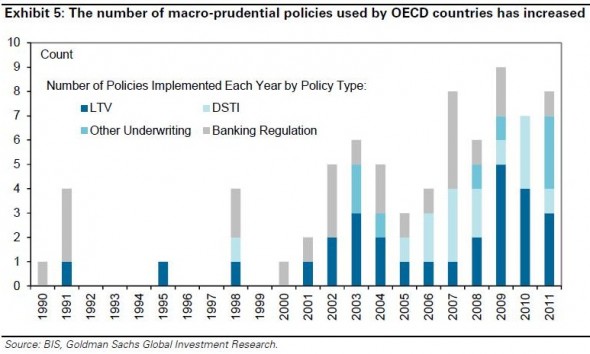
But the whole approach appears to be a recent phenomenon.
Which makes sense, given that the pricing of shelter from the elements has gone nuts attracted more attention in the last decade and for the last five years interest rate policy has been directed at economic revival and preventing deflation, while some countries such as New Zealand face exchange rate constraints.
Do they work?
Well, Goldman thinks there is some effect.
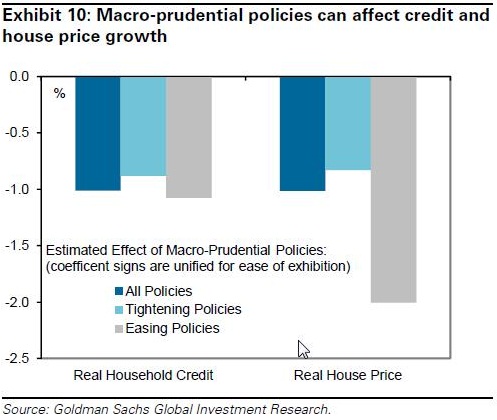
We find that macro-prudential housing policy, when designed to tighten (ease) mortgage availability, reduces (increases) the annual growth rate of real household credit by 1% and the annual growth rate of real house price by 1% (Exhibit 10). These estimates are statistically significant and are of economically significant magnitudes, given that the average annual growth rate is 5% for real household credit and 2% for real house prices in our sample. Estimating VAR and DSGE models using US data, Jarocinski and Smets (2008) and Iacoviello and Neri (2010) find that a 50bp increase in the federal funds rate leads real house prices to decline 0.75%-1%.5 Putting our estimates in this context, the average macro-prudential housing policy in our sample is equivalent to a 50bp change in the policy interest rate.
But note that the effect is not the same in both directions. It looks easier to encourage than discourage, when it comes to housing.
Remember though that this is an emergent field of research, and Goldman cautions against reading too much into the magnitude of its estimates.
But given the consequences to financial stability of housing booms and busts (in the US, Spain, Ireland, Japan…) should the research be taken as reassuring or concerning? For instance, in the context of that first chart above, a counter-cyclical measure that takes 1 percentage point off the annual rate of credit growth and house price growth is welcome but, some might conclude, far from sufficient.


