

447: Position for the 2013 crisis
09-29-2012
PropertyInvesting.net team![]()
QE3 QE Infinity: We had QE1, QE2, Operation Twist and now QE3 is confirmed open ended money printing targeting something new the unemployment rate. What this says is that the Fed is prepared to print as much money as it takes to reduce unemployment and has no real regard for the inflation rate. This policy is set to help their close friends the Wall Street Bankers by providing cheap money that the banks can hoard and speculate with. This will drive prices higher but not living standards.
Money Printing From Thin Air: The Fed is now printing $40 Billion a month in an open ended quantitative easing spree, in addition to the $45 Billion back-door Operation Twist. The timing is meant to prop up the US economy just before the US election to give the maximum chance that Ben Bernanke will retain his job after 2013 in conjunction with President Obama being re-elected. The stock market has been boosted as normally happens with QE and oil prices have surged. Gold and silver prices are up. The risk on appetite is re-ignited as cheap money flood in once more. For the time being, the US economy looks to be growing. But beneath this façade are huge problems:
· A so called fiscal cliff is reached January 2013 when taxes rises and spending cuts kick in these are thought to total 1.5% of GDP
· The pre-election boom and spending binge will end post election hangover will ensue
· Real inflation is more than 6% per annum though the government claims inflation of 2.5% - meaning real purchasing power and incomes are declining by at least 3.5% per annum, particularly as private sector wage inflation is <2%. 
· The US budget deficit is $1.6 Trillion per annum 10% of GDP
· The direct funded government debt is $16.2 Trillion 100% of GDP
· The unfunded liabilities including Medicaid, Medicare, Pensions and Social Welfare exceed $65 Trillion
· Dollar based paper derivatives are thought to exceed $150 Trillion
· Even with interest rates at a giveaway 0.25%, investment stays low, savings are destroyed by negative real interest rates and unemployment stays stuck at 8%
· The 30 year bond bull run with record low rates is about to pop this will cause a dollar crash and massively increasing inflation as a wall of dollars hits the streets
Living Standards Decline: The upshot of these economic wows is that real standards of living are declining for all but the super-rich. The high price of oil feeds through to retail prices for all goods and services and there is a kind of hidden stagflation taking place. The only way to government believe that high personal debt levels can be reduced is to inflate these debts away. If wages kept pace with inflation, it would be easier for the average individual to handle. But real inflation rates when housing and oil are taken into account are running at more like 6% - so middle and lower income people are feeling far worse off, especially as taxes rise and student loan payments sap disposa ble income.
President Obama Another 4 Years: Its pretty obvious to us that President Obama will be re-elected and Ben Bernanke will continue in his role. The main reasons are that he gives popular hand-out to voters and the Republicans are not communicating attractive proposals to the bulk of the electorate and keep making gaffs. For investors this means further gigantic money printing on a previously unseen level. Its the only thing Helicopter Ben knows to do its his only strategy. He is now targeting lowering unemployment with printing money. This strategy will almost certainly end in a massive crisis. Eventually unemployment will rise like it did in the late 1970s.
Never Pay Back: Firstly the US owes so much money it can never pay its debts back. If rates were to rise to even 6%, it would need 100% of its tax revenues to pay for debt payments. The US economy is in a zombie state bankrupt by most measures. But it still manages to lull investors in in the false belief that it is still a safe haven. The bond market rates continue to stay at record low levels implying almost zero risk. The bubble will surely go pop sometime soon. Its been a 30 year bond bull run and a whole generation knows only of declining bond rates and interest rates. But our view is this will start to change in 2013 when the US dips into recession Q1 2013.
We are only a few months away from the action now, so you should be positioning yourself and your investment portfolio for this.
Bubbles: When we look around at investments worldwide, its now very difficult to see really good investment opportunities that are clear cut. Big risks are present also in emerging markets like China and India because of bubbles and a likely significant global slowdown moving into 2013. Yes, bubbles develop, then deflate things are range bound but erratic and turbulent. Its likely oil prices could be driven higher if a war breaks out, but they could also drop sharply if demand destruction kicks in with a major western recession in 2013. Stock markets look over-priced when one considers the high risk of a major western recession in 2013. In the west, property prices look like declining further in most countries particularly those that are heavily indebted and/or are in decline such as Greece, Italy, Spain and Portugal.
Aging Babyboomers Key: One of the underlying causes of this western economic malaise is the aging baby-boomer population. The huge population explosion, particularly in the USA , from 1945 to 1963 means large numbers are now into their 50s to early 70s this is when their small families have flown the nest, they stop spending, downsize, spend less and try and save more. The boom years up to 2000 are over and the period 2016 onwards will see further declines in these peoples living standards. Aging populations in Spain, Italy, Greece and USA correlate closely with the decline in economic activity, suppression of GDP growth and general reduction in living standards married in with higher debt levels, less innovation and general societal decline. At least the murder rates drops as people get older. Youll see a plateauing of driving, car usage, travel and general activity levels things will seem a bit quieter as people stay at home as they get older. The western developed nations are now aging societies with a huge elderly population being given excellent healthcare to keep them living even longer. Less young people have to support more old people. Healthcare and pensions costs continue to rise. No wander living standards overall are in decline. No wander politicians are keen to see people work longer and cut pensions provision.
Japanese Analogue: If you are a bit sceptical about the impact of demographics on economic gr owth, one needs to look no further than Japan as the classic example. Their population exploded up until the end 1980s, then babyboomers started retiring in droves. They hoarded money, spent very little, and consumed less. GDP stayed flat for years. The stock market crashed to 35% of its original value in 1990 and a property market bubble in Japan and Tokyo in particular went pop real terms property prices are half of what they were in the late 1980s. Deflation set in and years of printed money, zombie banks and zero interest rates have failed to prompt the economy into action. The USA saw this has studied this - and has decided to be far more aggressive with their money printing to try and boost demand. But we believe they have gone too far and rampant inflation is now just around the corner the trigger could be the bond market bubble going pop or an oil price spike cause by conflict in the Middle East plus the fiscal cliff early 2013.
Depression: Its all a bit depressing and you might wander what there is left to invest in that could see stellar returns. Rather than letting economies re-adjust to reality, governments are printing and borrowing more currency to prop the employment levels up and give the impression of growth. But the jobs are more menial, productivity is not improving and innovation is stifled as inefficiency and easy money lead to poor business performance, practices and in-disciplined capital allocation. The printed currency goes into speculation rather than focussed capital investment towards innovation and productivity improvement. More people are creating less. This is particularly evident in the UK where the money printing has kept employment levels up but productivity is flat or declining and real growth is negative.
Gold and Silver: For us at this time, the clearest investment opportunity prior to a crisis in 2013 is physical gold and silver the real stuff not ETFs or paper gold or paper silver.
Its worth pondering on the following statistics:
· The US is printing money 18 times faster than the country is mining that value in gold and 4 times faster than the world is mining that value in gold
· Demand for gold has outstripped demand for ten years now by 1000 tons a year
· If you divide the total dollar derivatives by the total world gold the price would have to be $65,000/ounce to account for these dollars backed by real money or gold (not its current price of $1750/ounce)
· If you divide the total dollars currently directly in circulation by the total world gold the price would be $7000/ounce
· As fiat currencies are printed further into oblivion at some time government will need to revert back to a gold standard those with the gold will be the winners
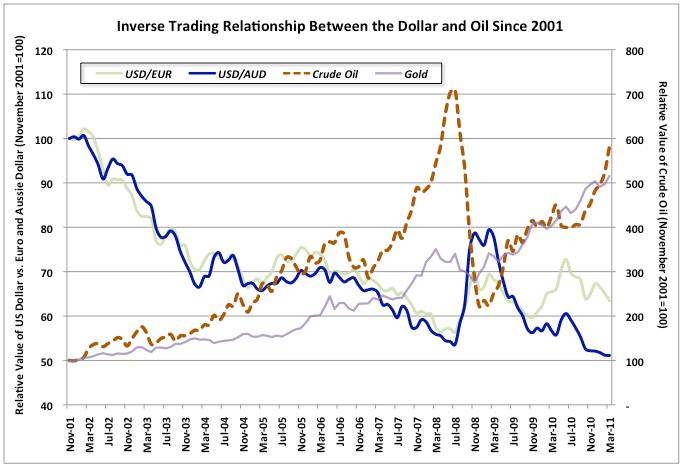
· The dollar has only 3% of its 1922 value in real terms even before this massive money printing scheme expect the dollar value to decline further at an accelerating pace now that QE3 has started
· The silver market is tiny about $23 Billion per annum any big bank or investor could buy up the whole physical silver supply for a year
· The silver price is manipulated downwards by JP Morgan a weak bank to give the impression of a string dollar - once this banks gets into trouble, its paper silver short positions will need to unwind and when this happens, the lid will be taken off the silver price, then this metals price will go ballistic
Its most important that you only buy physical gold and silver (at least allocated) from a reputable supplier. ETFs are very risky because there is no guarantee that there might be very little if any gold or silver behind these paper funds. If the bank running the ETF folds, you will lose all your money. The very safest way of owning gold and silver is to buy the physical metal and store in a safe deposit box in a low risk bank. It is definitely not advisable to store it at home.
Negative Real Rates: Fed rates 0.25%. Headline inflation is 3.6%. Actual un-manipulated inflation rates are more like 6+%. This is a negative -5.75% inflation rate. This is unprecedented in history. Meanwhile $40 Billion are printed every month. If this does not lead to general high inflation, we wander what would. It's a phenomenal rate of currency debasement and inflation - and it's just about to hit the streets.
Fed Currency Tidal Wave: The waves of printed money are claimed by the Fed to be required to bring down unemployment. But most smart investors know that this money is hoarded by the banks, not lent out, and is used to speculate on the stock market, oil, gold and silver. The money also boosts demand for bonds. A perverse cycling of currency. Now the printing pressed are going once more at high speed one can expect the stock market, oil prices and gold and silver prices rise sharply towards the end of 2012. But in 2013 we think a shock will occur the US will tip into recession. There could be a short period of deflation followed by very high inflation as money printing accelerates even further to prop things up.
Wildcard: The wildcard is Israel and Iran this looks like an accident waiting to happen. Nothing will happen until after the US Election, but by end 2012 regrettably we expect fire-works in some shape or form at the very latest by summer 2013. If conflict breaks out then oil and gold will go ballistic. If the Straits of Homez is closed for even a few days, ditto. There is a pretty large chance in our view that 2013 will look like 1980 with oil, gold and silver prices going through the roof.
Syrian Conflict 1970s all over again: The Syrian conflict is slowly spreading and we see this area as a particular trouble-spot with its history in the late 1970s and 1980s - also with its neighbours Lebanon. The Levant region is very unstable it is and has always been. Lots of factions with infighting so a general civil war is increasingly likely. This will do nothing for regional stability of course. The upshot will be higher oil, gold and thence food prices.
Euro Debt Crisis: Back in Europe the peripheral Eurozone countries are in constant crisis. Spains GDP is four times bigger than Greeces and demonstrations and threats of cessation and break-up of regions are making a sharp appearance. In Spain there are the Catalan and Basque regions that have long histories of aspiring for independence. As the economy deteriorates expect this economic hardship to translate into more problems particularly in the Basque region. The increasing in living standards from 1990 to 2005 help quash troubles things can go in reverse rapidly if people feel economically disadvantaged.
French Tax Heist: In France the new government will enact a 75% tax rate for the rich that will drive many of these people out of the country beyond any doubt the upper elite will be looking for a way out. They will simply cross the border to London, Switzerland or Belgium. The French tax receipts are bound to drop sharply and there will be a general brain drain. Paris property prices will crash and London property prices will rise sharply. Its all very predictable. This French tax rise is idiotic and should be a lesson for the UK government not to do the same thing it will probably cause a French recession because the top 1% high net wealth individuals are the people that create the jobs. They will move their jobs creation and investments overseas instead its that simple.
Stupid Mansion Tax Idea: The worst thing the UK can do is follow such examples. They will drive these French out of London if they implement anything like a Mansion Tax for instance. This idea is going around for a tax on properties with value over £1 million. Frankly, a person living in a sm all 4 bedroom terrace house in a quiet street in Wandsworth south London has a house worth £1 million but it does not make them rich. They might have an £800,000 mortgage. Some elderly people living in Wandsworth terraced houses might have no income, no mortgage and be forced to sell their homes to pay for taxes. Its ridiculous. Not to be able to live in a modest Victorian terrace house in London as a pensioner. Furthermore, the super-rich that London attracts create masses of jobs servicing their needs and wants to drive them away to live in places like Geneva or Monaco instead is lunacy. Its because London can attract the top global talent that businesses do well, jobs are created and corporate, private and personal taxes are paid. People already have to pay 7% stamp duty if they want to buy a £1 million home plus gigantic council tax bills. Further property taxes could cause a London property crash on the upper end of the market that would cascade down through the whole UK market and drive wealth creators overseas thereby damaging employment and overall tax receipts. The government would be stupid to enact such a tax. It would be stupid to risk a house price crash. If property prices go into free-fall, they would also loose tax revenues all around including capital. gains tax receipt and mortgage defaults would follow. Its massive inflation caused by currency debasement and money printing that has driven property prices higher so to create a further tax band at £1 million simply means over the next decade more and more normal people will be caught in this bracket as inflation rages from the money printing. 20 years ago a £1 million home was a mansion. It is now a pokey 4 bedroom terrace in Wandsworth (in south London, not even central or west London). In ten years time, we think about 40% of London property will be valued at over £1 million simply because of money printing, currency debasement and general inflation. Almost all prices have risen 10 fold in 30 years, so what makes anything think this wont happen in the next 30 years?
Oil and Gas Boom in USA: One final point on the positive side for the US is that it's gas reserves, gas production, oil reserves and oil production are all steadily climbing with oil prices at $10 0/bbl. Onshore fraccing of shale oil and shale gas has driven this trend in the last four years. Because of lower economic activity levels, oil and gas demand stay subdued - and hence natural gas prices are very low at $2/mmbtu - about six times lower than their peak in 2008. Oil imports continue to decline. The USA actually produces 83% of it's energy needs when you roll oil, gas, coal and nuclear power together. If it can reduce the 10 million bbl/day of oil it imports every day, this should give the country a big boost. It's quite possible if oil prices stay high that this 83% number will reach 100% in ten years time - with gas exports offset oil imports. Something considered almost impossible only six years ago when oil production was in severe decline. This is a good example of technological innovation, prices stimulating new demand and good management-processes and a failry free oil supply market creating this big bonus for the USA. This might partly explain why the US seems less concerned with conflicts in oil regions now compared to ten years ago?
US domestic oilfield production is now as high as in 1997 at 6.509 million barrels per day. Oil imports fell to 7.55 million bbls/day, a drop of 2.3 mill bbls/day since peaking in 2008. In 2006, the USA imported 13.7 million bbls/day - the first 6 months of 2012, average daily imports were at 10.86 mill bbls/day.
We hope this Special Report has helped give you insights into the investment landscape and how to position your portfolio before the real crisis set for 2013.